
LANGUAGE OF LEAN
Brown Paper Method
The Brown Paper Method is a practical tool to develop or improve process management in your organization.
What is the Brown Paper Method?
In this article we want to talk about the Brown Paper Method (BPM) in the context of process management.
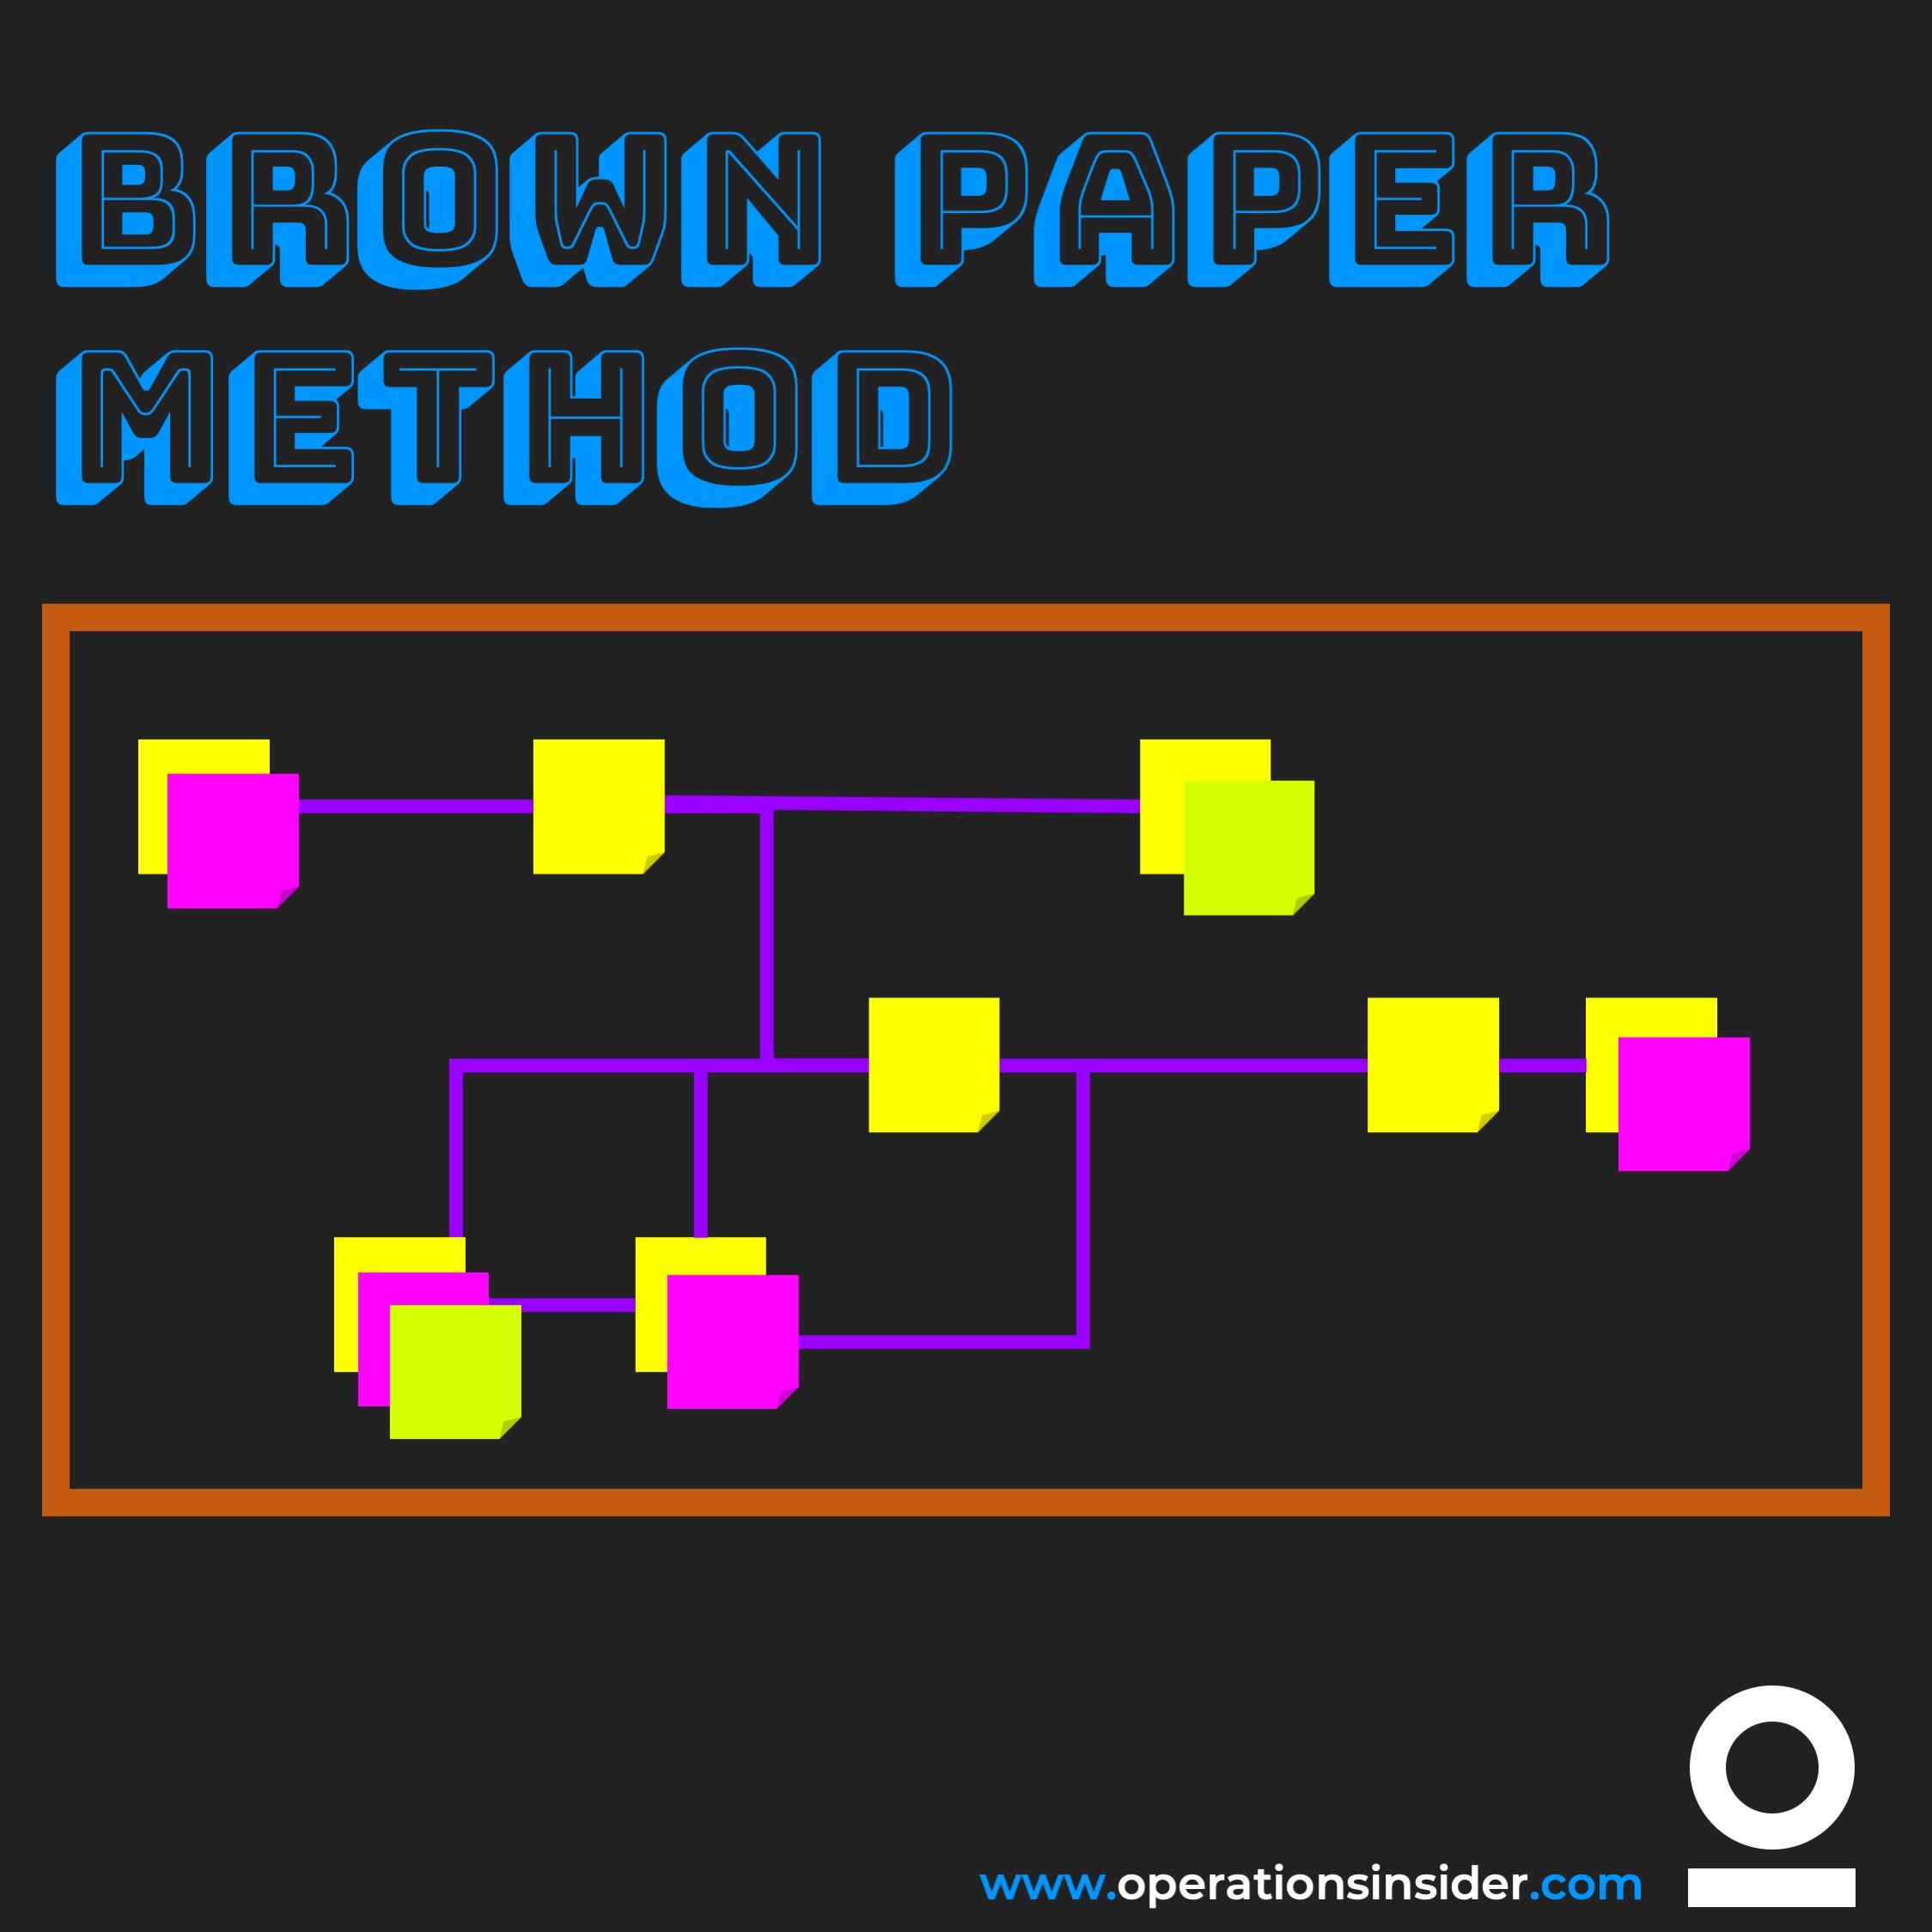
The Brown Paper Method is an easy to use tool for process development or management for your organization. During a workshop processes are drawn on a large piece of paper (typically from big brown paper roll sticked to a wall) and then analyzed.
Important: Draw the process as they really are not as you think the are. Do a Gemba Walk before this session.
So let us take it as a tool for process management. To be able to understand processes and procedures in your organization and to find out the weak points of them, it is depending on details. Getting those details can be tricky as they might be hidden in the process or in your employees minds and not always so obvious. As mentioned take the Gemba Walks and have a close look on the processes because it usually comes with a taste of complexity. With the Brown Paper Method you then have a simple tool to visualize the complexity in a simply way.
The Brown Paper Method is a pragmatic and result-oriented approach for process audits, presentations or analysis. It is based on a workshop where all involved persons of a process come together in person and collect their findings and doings on brown paper and draw the big picture of the process in total. Through the discussions, that will appear during the workshop, details will be pointed out that matter and defects or weakness will be described and visualized.
With the BPM, the actual process is collected, visualized and analyzed. Target processes can be also developed together. With the Big Picture of the process on brown paper all becomes clear for those involved and the tricky parts of the process are worked out and presented.
Based on the findings of the initial workshop the results are taken to the next level of process modeling. This includes the definition of the target process, implementation of automated workflows and process optimizations.
The process representation on the wall covered with brown paper can contain the following process characteristics:
What triggers and ends the process
Single process steps
Events
Suppliers and customers
KPIs can be important for the process flow (Defect rates, process times, etc.)
Process Input such as raw material, semi finished goods, pre-assemblies, toolings but also information and data such as reports or KPIs
Output and outcome such as finished goods or services
Employees actually executing process steps in the process flow
Employees that have an indirect influence on the process
Other teams or departments related to the process
and so on…
For the upcoming analysis following parts of the brown paper are discussed, additional information added and highlighted:
Critical activities that have a direct impact on the final result of the process including costs and time
Missing or missleading inputs such as information or defective parts
Wrong process steps that are distort the result
Incorrect or missing process step outputs
All potential to improve the process e.g. Kaizen activities marked with a KAIZEN flash
Which of these characteristics finally are listed in the process representation is up to the team as well as the weighting of each. This will then prioritize the potentials identified and when they will be tackled.

Lighthouse Project
When talking about Light House Projects this means nothing less than that a small sector of your organization e.g a department is already turned around.
When talking about Light House Projects this means nothing less than that a small sector of your organization e.g a department is already turned around. By that we are talking about living already the ideal state, that you defined for the complete organization.
Processes and structures can be seen as guidance for your organizations’ lean journey. It provides directions, shows what is possible and therefore is the kickstarter for a successful roll-out as people can convince themselves with their own eyes.
Just keep in mind that the lean journey with its process of continuous improvement is never over. The pioneer has to lead the way.

Continuous Improvement Process
The continuous improvement process is a method to continuously improve processes and procedures in companies or organizations.
Well known, not only in the lean world is the continuous improvement process (CIP). As it says it is a methodology to continuously improve your processes and procedures in your organization. In short = there is always something that can be improved. CIP is not only a saying it is a mindset and should be deeply anchored in your organizations DNA. Therefore it is a must to be lived and demanded by management as well as to be trained and implemented. As per definition the continuous improvement process has no ending it follows the cycle of PDCA over and over again. The basic principle behind CIP is to consistently observe and analyze your processes, take in consideration employees ideas for improvements, implement those and reassess the results if they are according to planned outcome.
Where das CIP come from: A short excursion in history.
In the 1950s, Japanese companies, best known Toyota, started to integrate the "KAIZEN" philosophy of life in operations. The Japanese word KAIZEN stands for "change for the better". To sum it up it means the continuous improvement process by small steps, every day. The ultimate target above all is to reach the highest customer satisfaction possible which guarantees economic success and is achieved by highest quality of goods and services. So they have to be constantly improved. Just think about the KANO - Model.
From the 1980s, European and American car manufacturer started to adopt the CIP methodology to increase their quality and by this their performance of finished goods.
Since the 1990s the CIP methodology made its way from the shop floor into the offices and has a straight impact on an organizations culture. With the so called PDCA cycle it is a never ending process and supports your whole organization on the path of sustainable growth.
Nowadays it is even part of the ISO9001 that defines the continuous improvement process as one of the "seven principles of quality management".
How to apply CIP
As discussed, CIP means improving through a consistent path of small following steps. Basic prerequisite is the ultimate will of your organization's management and the involvement and motivation of all employees in your organization. Focus on customer satisfaction > What is the customer willing to pay for? Everything that has no value for the customer must be seen as waste and has to be eliminated.
In real life organizations take the CIP approach to conduct regular audits by the Lean/Opex-Team. They analyze current issues or challenges and make suggestions for improvements. Typically the following approach can be seen as a rough guideline.
What should be improved?
Define the process, area or procedure
How should it be like and what is it like now? > Define the Delta
Numbers cracking > Go through the figures, actual and target state.
Describe the deviation or problem
What is the outcome by this deviation?
What are the costs of the deviation? Loss of quantity, rework, etc.
What is the root cause of the problem?
Analysis
What are the potential solutions?
Idea and Solution Mgmt. through teamwork and brainstorming sessions
What solution is the best?
Evaluation of the best solution defined
What measures need to be taken?
Cost-Benefit analysis
Results are presented to decision makers
Defined measures are adopted
Who does what, with whom and at what costs?
Measures are implemented
Verification of effectiveness through KPI tracking
If necessary re-evaluate measures to meet targeted outcome
You see, the methodology is very close related not to say a spin off the PDCA cycle.
The endless, repetitive PDCA cycle basically means permanently observing the processes, analyzing bottlenecks and weak points, develop solutions for improvements. To get a better understanding of PDCA read the article here.
In short:
Plan
Recognition of improvement potential, analysis of the current situation, development of improvement measures
Do
Implementation of defined measures
Check
Check the effectiveness of implemented measures with predefined KPIs
ACT
Constantly monitor and review the improvements through audits or reporting. When expected level of improvement is reached adjust the standardization to new level. If you failed on the expected outcome restart the PDCA cycle.
After the PDCA cycle is finished your area of improvement focus will change. E.g. your bottleneck process will move along the complete process.

True North
"True North" - a concept that plays a key role in the journey of lean management and the road of improvements.
"True North" - a concept that plays a key role in the journey of lean management and the road of improvements.
The principle of the true north goes back to the beginnings of the Toyota journey and means nothing less than the direction go for in order to reach real operational excellence.
True North defines the scope of your journey and the boundaries where you want to take your organization to the next level or where you want to have it. Some see it comparable as a mission statement or a reflection of purpose of your organization but for sure the foundation of your strategic planing.
You've got to be very careful if you don't know where you are going, because you might not get there.
Yogi Berra
Make sure that you understand that depending on your perspective the True North can be for everyone different based on their point of view. But in Lean Management or Operational Excellence with True North you define a specific set of ideals that are providing a compass for your organizational change. No matter if you talk about strategy, processes, culture or geographical challenges.
With the help of the True North principle it is clear to what you should do and not what you can do. In the Lean World you might have heard about the term of the Ideal State the Ideal State defines a state of perfection in your complete organization. Thinking about processes - a process is then as simple as possible when you can’t take anything more off it. This is state you are aiming for.
The continuous improvement process has no end, and you will constantly drive the PDCA cycle over and over again - only the starting point shifts to the next level.
But no matter what, it is like sailing on the ocean, without navigation you won’t reach the shore. The ironic part of it: you will never reach the shore - speaking of being done improving. True North is a way of running your organization not some final defined target state. It describes your daily practice of beating yesterday.
Target Agreement
A Target Agreement is a management technique where employees and management together reach an agreement on how achieve the organization’s targets.
A Target Agreement is a management technique where employees and management together reach an agreement on how to achieve the organization’s targets. It thereby consists of two key elements:
The TARGET
and the ACTIONS
Targeted state including the measures taken to achieve the set targets. Think about KPIs - a combination of quantitative measurable targets and an action plan following the PDCA.

Key Performance Indicator
A method of tracking or monitoring the progress of existing daily management systems.
Key Performance Indicators are measurements utilized to indicate the performance level or progress with regard to important objectives or defined success factors within your organization. To make it short KPIs are used to track or monitor the progress of your existing daily management system.
So how do measure our progress of our organization? How can we define what type of indicators we should use and what they tell us about the current state of our processes? And so on…
These are just some questions that might rise when thinking about implementing KPIs in order to better understand your organization and define a path to go for improvements. What processes are truly adding value to the final product or service the customer is willing to pay for and what is just waste?
Before you start implementing KPIs in your organization a helpful way is to categorize KPIs in two ways: leading and lagging indicators.
Leading Indicators
Leading Indicators are Performance Indicators that are tracking your process. So these are real time figures showing you deviation to given standard or if there is something missing in order to produce your goods or services. They have a real time effect on your delivery performance. The fun part with leading indicators is that you have real time results why it can also take months for a report showing how your organization is doing in general.
For example, talking about injuries, when an operator is involved in an accident during a process step. This incident will be documented on an incident rate report of the organization, for e.g. factory. So when you think about it you recorded an incident after it happened. This is a necessary process in the majority of organizations due to governmental regulations and safety laws. The question to ask is now what do you do with this information? Do you really know what caused it? The information is quite old. This is why the incident report is not a leading indicator but a lagging indicator.
Lagging Indicators
As just mentioned Lagging Indicators are result-oriented, because of this they are shown after something happened. With lagging indicators you react after an amount of time as you are reacting on something that is already in the past. Coming from automotive this is typically a customer claim in the field, you will have a lot of work to do to find out what actually caused the failure, if no proper traceability is installed. Attention: With those failures it is often miss leading that through assumptions symptoms are fight that are not real. Everybody from Task Force Managers to shop floor firefighters knows that. In this case you are not adding any value nor do you implement a sustainable solution.
Having this two categories in mind we can say that the majority of KPIs are lagging indicators. This is not only in the field of manufacturing. The most miss leading assumption thereby is that with Lagging Indicators we get the most information.
But openly asking - isn’t it better to prevent the accident before it happens? This is absolutely speaking for Leading Indicators - and by focusing on Leading Indicators your focus in daily operation will shift to your process and not the overall outcome. In fact: when focusing on improving your process as a side effect the overall outcome will increase automatically.
Where to start with KPIs?
First things first - don’t overdo it!
Start to ask yourself what is your daily business? What processes are constantly and repetitive in use? The same principle with Gemba Walks go to your employees and talk to them - ask what is doing well and what not. What can improve their work?
The situation can be daily checked with line reviews or the so called meeting cascade. Where on the lowest level with the shift hand over performance KPIs are reported and issues during the shift are addressed. This figures are then visualized on the e.g. “Cell Board” near the outline of the cell itself. Typically if you have an U-Shape Layout at the spot of raw material and finished goods.
If something goes wrong latest after one shift the focus will be on this process. This automatically prevents new incidents from having a threatening impact. This is the advantage from getting things done right away or afterwards when the game is already over.
Finally to bring it in a nutshell, try to bring your KPIs from lagging into leading. This will shift the focus on the whole organization towards daily processes and improving them with the help of daily Kaizen activities. Measuring the process constantly in real time gives you the opportunity analyze trends and adjust processes to be ahead of the game instead of being surprised by the market.
Analyze your data existing decide what to go for. Implement your KPIs and make sure they go hand in hand with a meeting cascade. This ensures the consistency of data used and that they are actually used to trigger actions. Based on the KPIs you will be able to drive focused improvement actions through shop floor management, visual management, standardized work and structured problem solving.

Visual Management
How visual management can help you to keep the overview of your operations.
Hej there! Great to have you back! In this article we want to show how visual management can help you to keep track in daily operations.
Generally speaking Lean Management can be seen as a clearly organized workflow that defines the way your organization should work following given principles. Above all principles existing lies to avoid waste in any kind following the 5S Principle as foundation: 1 Sort out 2 Set in order 3 Shine 4 Standardize 5 Sustain.

For a clear visualization of running process in your organization, cleanliness and orderliness is the main part of it. Clarity of your processes on the shop floor is the foundation for all lean manufacturing activities. Having the clarity the implementation and maintaining of visual management methods will guide you to a real state of flow.
In the following we want to describe key basic visual management elements that every production, following the lean principles, should have.
Boards, Notes, Infographics, Brochures and even Movies
Don’t panic and try to explain all those Japanese words it works well without being too technical. Many instruments of the Lean Manufacturing Methodology are very useful to raise the awareness of your employees about lean management. Once implemented and continuously driven by the management the incentives are there to drive daily improvement measures.
The target with visual management and those methods are all the same:
Create transparency
Visual representation of procedures processes and services
Making problems (or bottlenecks) visible
Kanban Boards
Kanban can be literally translated as “card” in the context of a production system. No matter what processes you have, it all starts with a customer’s order. The Kanban card is then used to inform upstream processes about the need of materials, pre-assemblies or process steps. This automatically leads to a cycle that triggers itself through the complete value creation chain.
This is the so called pull principle the advantage if this principle is that, in best case, you have no work in progress which means you have no stock of semi finished goods built up, because only what the following process steps need is produced.
A3 Reports
The term A3 Report comes simply from the size of paper which is used for the documentation of the report. The structure itself follows the PDCA methodology.
The A3 Report is the representation of a problem to be solved. In this case the responsible person from the quality department takes the A3 Report, starts the problem solving actions and follows a systematic structure that makes it possible to describe the effects that are currently leading to a deviation from the standard. Using the A3 only makes sense when you don’t know the root cause yet. If you already know the root cause don’t waste your time. Fix it and go back to normal.
Andon: Lean management with boards and ripcords.
Andon again a Japanese word meaning “lantern”, at least in the context with lean manufacturing. It is a visual aid that is there to draw attention to problems on the shop floor when machines or processes are causing defects or simply stop working.
You might think you have seen them all by walking through production and seeing all those PLC signal lamps indicating green or red, but there is so much more. Just have a look at the Andon article.
Just want to name administration, maybe there is nothing to indicate, but when you think about a document that is needed in a different department, waiting for this is one of the TIMWOODS MUDA. The time waiting is probably the best indicator to start with lean admin activities.
Andon Cords - Please pull the rip cord in an emergency!
Andon Cords are rip cords or a simple button straight at the operation on the shop floor that gives the operator in the process the possibility to instantly stop the line when problems or defects occur.
Andon Boards
Andon Boards are displays or nowadays mainly TV screens that are showing the actual status of the manufacturing line e.g. PPM, down times, etc. Typically it is automatically feeded by the machineries of the production line. With the standard defined color indication everyone sees if they are doing great or not so great. In the second case an automated alert to supervisors or maintenance is triggered.
You see there are many possibilities, but the target is always the same. One hint at the end: Make your boards, infographics or brochures as simple as possible! (or just use mine ;))
WHY? As with processes > it is only a good process when you can’t cut anything more away from it. In other words: What is the value you get from something that nobody understands?
If you take the principle of visual management seriously it will help you to bring all processes in your organization to live.

Set up time reduction
Set up time reduction. Nice and simple.
First things first. In order to reduce set-up time the set-up process itself must be observed and analyzed (e.g. by using the EMIPS - eliminate, minimize, integrate, parallelize or synchronize - methodology).
After you have analyzed the process make sure you write down all identified kinds of waste. Try to define the ideal state of the new procedure. Only after verification through testing of the new procedure make it a standard and implement it in your TPM framework. By doing so your operators are now responsible for the new set-up procedure, assumed that your operators are properly trained.
The whole focus on set-up time reduction comes from the customer requirements to manufacture a higher variety of goods in smaller batches. In order to meet those requirements set-up or change over must be kept as short as possible.
But let us go a little bit more into the details.
The pure set-up time is defined as the time needed to change from the last part of a batch to the first part of the following batch.
The set-up includes all activities needed, preparation, action on side and adjustments needed. By doing this you automatically differentiate between so called “external” and “internal” activities.
The following steps should help you to make it easier to reduce set-up times
1 Classify each part of the set-up process to either internal or external. Internal steps are those that only can be done while the production is or has to be inactive. External steps are done without interrupting production.
2 Convert internal steps to external ones. The whole idea is to minimize the time needed shutting down operations. This is why we want to take internal steps out as much as possible.
3 Reduce the time needed for the remaining internal steps. There are for sure some steps you can not take out, for those the manufacturing has to be stopped. The whole focus is now on this internal steps and how to reduce them to an absolute minimum. Here the SMED methodology (Single Minute Exchange of a Die) can help. Too find out more you can read here.
4 Eliminate adjustments. Last but not least try to get stable process parameters. With effective process control in place you can get rid off adjustment activities.
A Pareto Diagram can be useful to prioritize the setup time reduction activities. Don’t start everywhere at the same time! Start with the biggest loss and you will see over the time how it will change. It also gives you a great opportunity to see the progress that you are making on set-up time reduction.

Waste
The opposite of value creating are non-value adding activities. Those can be remembered with TIMWOOD.
Waste (MUDA)
Waste or MUDA is the opposite of value creation. Waste describes all non-value-adding activities the customers are not willing to pay for. The two main categories are obvious and hidden waste. While obvious waste can be eliminated, hidden waste can only be minimized.
When talking about waste there is no way around the 7 kinds of waste according to Taiichi Ohno most known in the lean world as TIMWOOD. Feel free to read the complete article on TIMWOOD(S) - yes you are right - where is this S coming from… keep on reading and you will see.
The 7(8) kinds of waste:
T = Transportation
I = Inventory
M = Motion
W = Waiting
O = Overproduction
O = Overprocessing or - engineering
D = Defects
S = Unutilized stuff
It is important to be aware of these kinds of waste in the list. But overproduction is the worst and typically initiates the other types of waste.
To read more in detail about TIMWOOD go here.

Production Diary
The production diary, as part of the shop floor management system, defines a shift based weekly forecast incl. upcoming tasks for mgmt., supporting functions and is openly displayed on the shop floor.
With the help of a production diary, based on a pre-defined shift planning all other functions and outcomes are planned and tracked. This includes the mgmt. team as well as all supporting functions. In order that everyone is aware about the upcoming week the production diary is openly displayed on the shop floor. With the production diary and the pre-set structure of daily meetings of the shop floor mgmt. all daily activities are carried out. Best known part is e.g. Gemba Walks and the included problem solving activities e.g. A3 or just confirming that all processes run as planned.
With this big part of shop floor mgmt. it is clear that all regular meetings planned along the production diary are set. All other unplanned activities or extra meetings need to be conducted respecting the fixed schedule of the production diary.
Stay Connected

Ad
We want information fast and in a nutshell. We from OI recommend Blinkist* - because it’s simply the best.
* = Affiliate Link


